Firehose #193: 🦸♂️ Mega Marketplaces 🦸♂️
Why some marketplaces can drive their flywheels faster.
One Big Thought
Marketplace IPOs are commonplace today, but just 5 years ago they were a rare commodity. To quote myself in Firehose #187:
Of the publicly traded, independent US marketplaces that exist today, only 6 were public companies in April 2016 — EBAY ($30B), GRUB ($1.8B), GRPN ($1.8B), ETSY ($715M), CHGG ($321M) and OSTK ($234M). These companies were worth a combined $34B, 88% of which was EBAY — a company that was already 20 years old back then.
Since then, the public markets have embraced 16 new consumer marketplaces ranging from travel (ABNB*), logistics (DASH, UBER, LYFT), apparel (POSH, REAL, TDUP*, FTCH), real estate (OPEN), e-commerce (WISH), automotive (CVNA, VRM), events (EB), and services (ANGI, FVRR, UPWK). EBAY has shrunk from 88% of aggregate marketplace enterprise value to only 10% today. Aggregate enterprise value has exploded to $474B across these 22 listed companies. Of the $440B of gain in enterprise value over the last 5 years, only 15% came from the original 6 stocks. These 16 new marketplaces have been responsible for nearly all the incremental value creation.
With all these additional public companies, we can finally make some generalized observations about the marketplace business model. The most important characteristic of a marketplace is its flywheel. The flywheel dictates not only how fast a marketplace grows, but what constitutes its moat over time. Below are some of my favorite examples from DASH, UBER, Faire*, FTCH, and ABNB*.


Flywheels give marketplaces inherent momentum. Like a powerful locomotive, they are painful to get started, but difficult to slow down. The fact that Craigslist — a product that has made very few changes since the late 1990’s — still dominates certain markets in the US is evidence that liquidity, which governs the flywheel, is the most important component of a marketplace. Everything else is secondary.
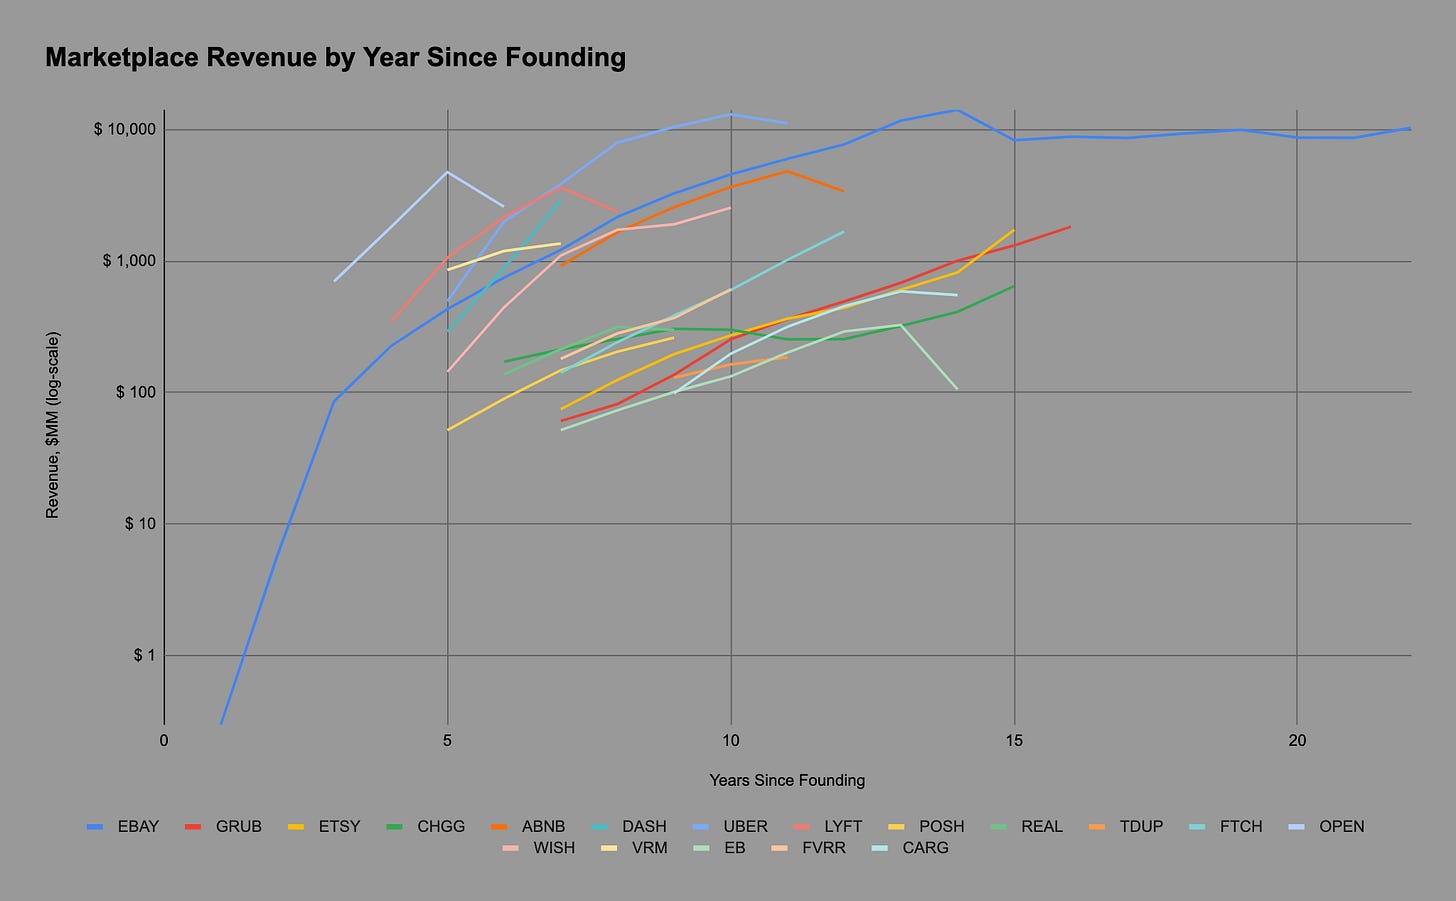
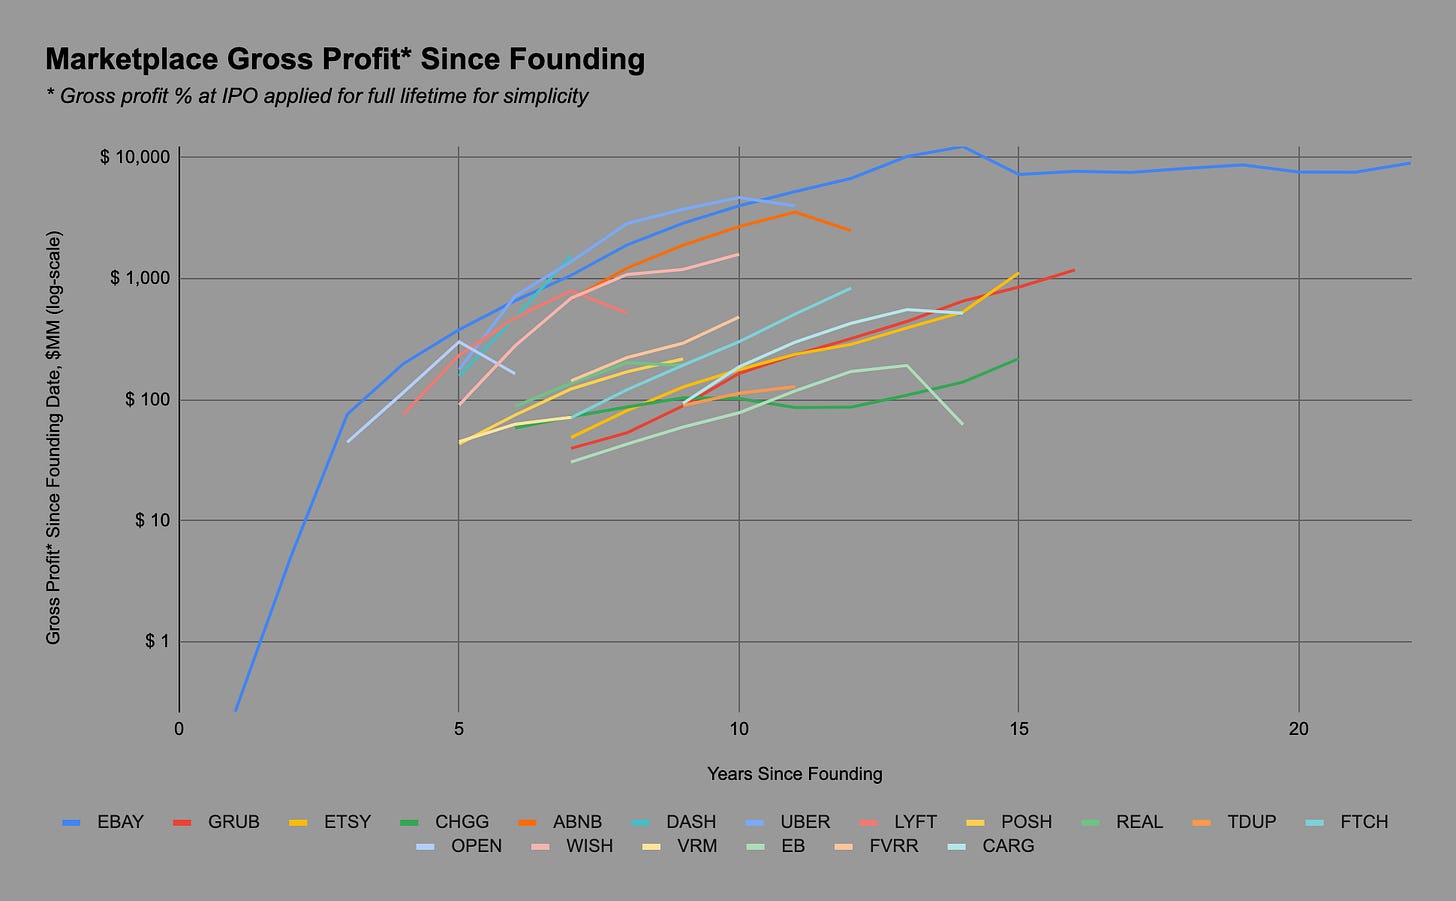
Some flywheels spin faster than others. I spent time this weekend looking at the path to IPO for a number of publicly traded marketplaces. I found that the companies can be split neatly into two groups based on rate of growth since inception.
The grouping is tighter when we plot annual gross profit instead of revenue, since it puts businesses like OPEN (6% GM at IPO) on level footing with those like FVRR (79% GM at IPO). I’ll call the upper grouping in the gross profit chart the Mega Marketplaces (EBAY, DASH, UBER, LYFT, OPEN, WISH, ABNB*). They roughly track the ascendence of EBAY in blue. I’ll call the lower grouping Steady Marketplaces (GRUB, ETSY, CHGG, POSH, REAL, TDUP*, FTCH, VRM, EB, FVRR, CARG). They roughly track the path of GRUB in red.
The differences between these two groups are significant:
Time to IPO. The average Mega gets to IPO two years earlier (8 vs. 10 years after founding).
Gross margin at IPO. The average Mega has a significantly lower gross margin at IPO (49% vs. 61%). That’s because the Mega’s are mostly in “commodity” industries like food, transportation, and real estate.
Faster to $1B+ in gross profits. The average Mega achieves $1B in gross profits 8 years after its founding, at which point the average Steady has around $100M of gross profit. That order of magnitude difference is counterintuitive since the former actually has lower margins on a percentage basis than the latter.
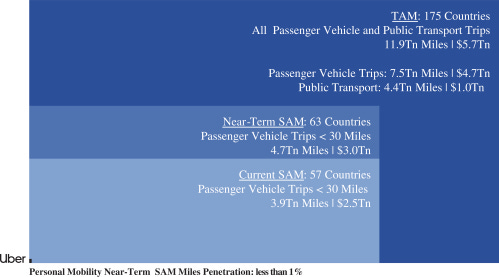
The qualitative differences between Mega’s and Steady’s are a bit murkier. At the risk of seeming reductionist, it might all come down to a market size measured in trillions, not billions. UBER declared in its S-1 that its current serviceable addressable market (SAM) was $2.5 trillion:
ABNB had a similar feature in its S-1:
We have a substantial market opportunity in the growing travel market and experience economy. We estimate our serviceable addressable market (“SAM”) today to be $1.5 trillion, including $1.2 trillion for short-term stays and $239 billion for experiences. We estimate our total addressable market (“TAM”) to be $3.4 trillion, including $1.8 trillion for short-term stays, $210 billion for long-term stays, and $1.4 trillion for experiences.
OPEN positioned itself to address the 87% of US homes within the $100-750K buy box, which constitute a $1.3 trillion addressable market:

DASH cites third party reports in its S-1 that peg $1.5 trillion of food spend in the US, of which $600 billion is out-of-home:
We are the category leader in U.S. local food delivery logistics today and have an enormous market opportunity ahead of us in food alone. In 2019, Americans spent $1.5 trillion on food and beverages, of which $600.5 billion was spent on restaurants and other consumer foodservices.
While Steady Marketplaces must also address sizable markets, their respective paths to scale are likely slower because those markets are “only” measured in billions. FTCH, for example, is an admirable company with nearly $2 billion in net revenue, but it addresses 10-25% of a Mega’s addressable market. See below from its F-1 filing:
According to Bain, the global market for personal luxury goods was estimated to reach a record high of $307 billion in 2017, growing at a 6% CAGR since 2010, and in 2017, the personal luxury goods market experienced growth across all regions. Bain also states that online has become a larger percentage of the overall market, growing at a 27% CAGR since 2010.
Obviously, everyone wants to go after a big market. If you had to choose a trillion dollar market or a billion dollar market, why would you ever choose the latter? Well, smaller markets often have less competition and, therefore, higher margins. Those margins can present an attractive entry point for an online marketplace. It’s much more common, and probably more advisable, to attack a fat margin pool if you see one. Yet, the biggest markets of all (food, transit, healthcare, energy, etc.) are very competitive and low margin. The data clearly shows that an effective flywheel in one of these markets produces the biggest outcomes fastest.
To paraphrase a famous Jeff Bezos quote, two kind of companies exist — “those who work hard to try to charge more, and those who work to charge less.”
The Mega’s are the latter.
Tweet of the Week


Enjoyed this newsletter?
Getting Drinking from the Firehose in your inbox via Substack is easy. Click below to subscribe:
Have some thoughts? Leave me a comment:
Or share this post on social media to get the word out:
Disclaimer: * indicates a Lightspeed portfolio company, or other company in which I have economic interest. I also have economic interest in AAPL, ABNB, ADBE, ADSK, AMT, AMZN, BABA, BRK, BLK, CCI, COUP, CRM, CRWD, GOOG/GOOGL, FB, HD, LMT, MA, MCD, MELI, MSFT, NFLX, NSRGY, NEE, NET, NFLX, NOW, NVDA, PINS, PYPL, SE, SHOP, SNAP, SPOT, SQ, TDUP, TMO, TWLO, VEEV, and V.


Any chance I could get access to the data behind your charts?
Currently working on a Back Market case study :)