Firehose #181: 🚴♂️ Dashing to IPO. 🚴♂️
Doordash serves up its S-1. Plus: Unpacking SPACs, Netflix tests podcasts, Apple drops Intel, and the linkage between gut health and Alzheimer's.
One Big Thought
Doordash dropped its S-1 this week. I read through the filing this weekend and found it to be one of the most transparent, well argued prospectuses for a consumer business in recent memory. This week, I wanted to highlight a few elements of the S-1 that I found compelling and potentially useful for others constructing pitches.
A case study in cohorts
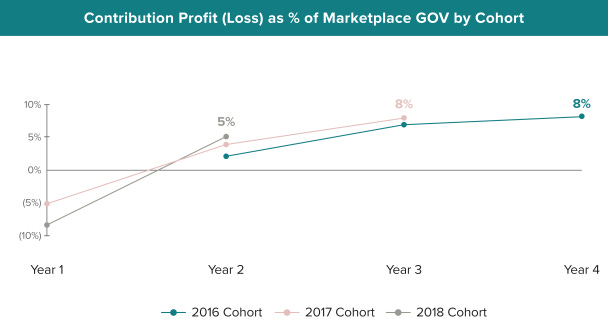
Doordash (soon-to-be DASH) reveals incredible detail in its cohort data. This contrasts sharply with Uber (NYSE:UBER), which revealed almost no cohort data in its IPO filing in 2019. Perhaps the most important chart in the entire S-1 is the cohorted contribution graph:
DASH defines contribution profit (CP) as gross profit less sales & marketing costs, with a few non-cash items added back. CP is negative in Y1 due to spend on customer acquisition. In subsequent cohort years, DASH levels out its re-engagement marketing spend to ~2% of gross order value (GOV). That implies gross profit (GP) rises to 10% of GOV as cohorts age.
DASH therefore invests around 7-10% of GOV to acquire a customer in Y1. That customer then generates 5-8% of GOV of CP in each year thereafter. This implies a 12-18 month payback on customer acquisition, and 3-4x LTV/CAC over the first 3 years.
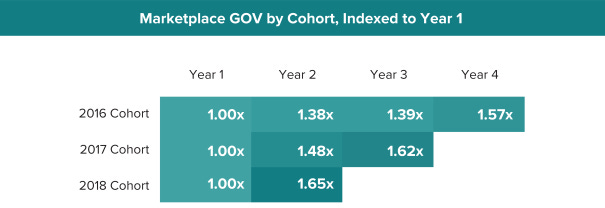
In addition, DASH gives us some insight into the compounding GOV growth of its cohorts with the following table:
At this rate, the cohorts compound at least 160% annually. A 3-year compounding period would put the cohort at 4x cumulative GMV, which roughly corresponds to the aforementioned unit economic ratios.
The consequence of these stable cohorts and attractive marketing payback ratios is that DASH will be able to compound its growth for years to come, with older cohorts baking in a “same store sales” baseline of organic growth. Over time, this dynamic can result in significant operating leverage, as I tweeted about earlier this week:
A granular view of unit economics
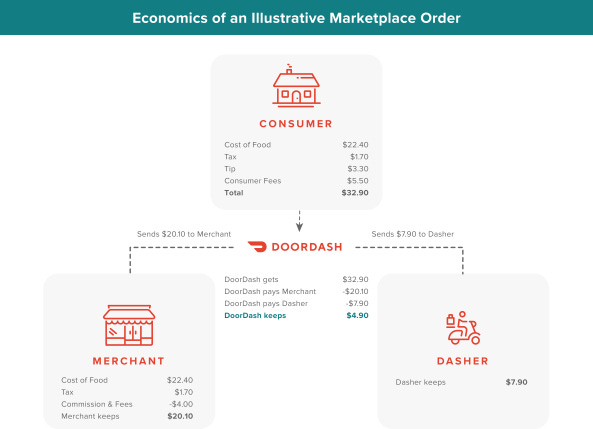
DASH puts together an intuitive breakdown of the economics of a single order. Because it serves 3 parties (consumers, merchants, dashers), the flow of cash between them is more complex than it is for most marketplaces:
The filing also breaks down the granular components of contribution profit and tracks changes from 2018 to 2019:
Here you can see the increase in take rate from 10% to 11% from 2018 to 2019. You can also see that DASH traded off improvements in COGS (-8% to -6%) for additional investments in sales & marketing (-5% to -7%), maintaining a constant CP of -2%. Watching these tradeoffs gives one a sense for how management runs the business. In this case, management is investing additional cash flows from operational improvements in growing the business faster. You’ll see why in the next section.
Crystal clear strategy
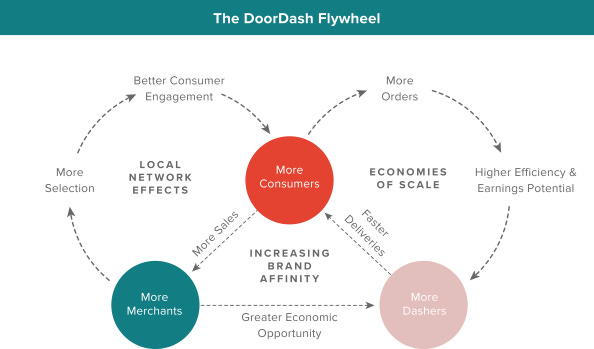
DASH boils down its business to 3 interlocking, virtuous flywheels:
The explanation touches upon the 3 key strategic elements of DASH’s business:
• Local Network Effects: Our ability to attract more merchants, including local favorites and national brands, creates more selection in our Marketplace, driving more consumer engagement, and in turn, more sales for merchants on our platform. Our strong national merchant footprint enables us to launch new markets and quickly establish a critical mass of merchants and Dashers, driving strong consumer adoption.
• Economies of Scale: As more consumers join our local logistics platform and their engagement increases, our entire platform benefits from higher order volume, which means more revenue for local businesses and more opportunities for Dashers to work and increase their earnings. This, in turn, attracts Dashers to our local logistics platform, which allows for faster and more efficient fulfillment of orders for consumers.
• Increasing Brand Affinity: Both our local network effects and economies of scale lead to more merchants, consumers, and Dashers that utilize our local logistics platform. As we scale, we continue to invest in improving our offerings for merchants, selection, experience, and value for consumers, and earnings opportunities for Dashers. By improving the benefits of our local logistics platform for each of our three constituencies, our network continues to grow and we benefit from increased brand awareness and positive brand affinity. With increased brand affinity, we expect that we will enjoy lower acquisition costs for all three constituencies in the long term.
With this in mind, you can see why DASH would plough its margin gains into increased spending on growth. More growth drives the flywheel faster, which brings more future margin improvements.
The chart also implies that brand is its own flywheel. “Brand” is one of those fuzzy concepts that Silicon Valley people tend to shy away from. It’s often viewed as subjective, or at best difficult to measure. After a decade of working with consumer-facing businesses, I can say that brand is very much a real thing and can build on its own success. However, brand is not an input to the flywheel; it’s an output. A great brand is what happens when you operate the business well. It’s a promise to the next cohort of customers that the service will be excellent. DASH gets this concept and features brand prominently in its strategy.
Distinctive insights that drive performance
The S-1 is littered with little insights that show the distinctive way in which DASH operates. Here’s an excerpt from the cultures/value section:
Operate at the lowest level of detail: Averages in our industry are meaningless, it’s the distribution that matters. No consumer cares if our average delivery time is 35 minutes if they received their food in 53 minutes. At DoorDash, we go to the lowest level of detail to understand every part of our system, looking for “and” solutions that fight false “either/or” dichotomies. This is one reason why everyone at DoorDash, including me, tries to step out of our day-to-day roles once a month to do a delivery or engage in customer support, menu creation, or merchant support—staying very close to the needs of those who use our platform is key. We attribute our category-leading spend retention and capital efficiency, in part, to this obsession.
Getting obsessed with the tails of the curve, not the average, is a great way to encapsulate what’s necessary to succeed in consumer-facing businesses. Fans are earned or lost at the margin. It’s not the average performance that counts.
DASH also revealed the core insight that differentiated it from its competitors in the early days:
We believe that suburban markets and smaller metropolitan areas have experienced significantly higher growth compared to larger metropolitan markets because these smaller markets have been historically underserved by merchants and platforms that enable on-demand delivery. Accordingly, residents in these markets are more acutely impacted by the lack of alternatives and the inconvenience posed by distance and the need to drive to merchants, and therefore consumers in these markets derive greater benefit from on-demand delivery. Additionally, suburban markets are attractive as consumers in these markets are more likely to be families who order more items per order. Lighter traffic and easier parking also mean that Dashers can serve these markets more efficiently. As a result of our early focus on and experience with suburban markets and smaller metropolitan areas, we are particularly well positioned for continued growth in these markets.
It’s hard to recall how unintuitive this insight was at the time Doordash started. Everyone assumed that the superior customer density of cities, selection of restaurants, and availability of couriers would lead to superior unit economics. In addition, Uber was relatively underpenetrated in the suburbs, so when it launched Uber Eats, it had fewer drivers to deliver and compete with DASH in those areas. When you start with mobility, you need to focus on cities. That requirement allowed DASH to win in the suburbs with superior margins.
In summary, I found the combination of quantitative and strategic insights in the S-1 to be illuminating. I hope that more companies in this IPO season reveal this level of transparency and insight into their respective businesses, and that some of this analysis inspires earlier stage companies to do the same.
Tweet of the Week
Links I Enjoy
#commerce
Not all SPACs are created equal. →
The rapid influx of capital into SPACs has resulted in dramatic changes to a once fringe component of the capital markets. Since 2015, SPACs have seen far fewer liquidations (10% vs. 20% previously), the average size has doubled from $200m to $400m, and mainstream investors from other asset classes have entered the fray.
Among these new SPAC investors, performance is not evenly distributed. A new study by McKinsey shows that SPACs with operators at the helm outperform those without operators by over 40% over the 12 month period following the merger. In fact, operator-led SPACs outperform the market index of the underlying company by 10%. For the first time, we have evidence that, with the right team and governance setup, the SPAC structure can produce superior results.
#media
Podcast and chill. →
I almost missed this short article a few weeks ago about Netflix* entering the audio-only space. Historically, Netflix has gone through two product phases. The first was the original DVD-by-mail business. The second is the current, streaming service. Philosophically, Reed Hastings has stated that he would rather expand into new types of content with a single platform to deliver it, rather than enter new content types (think gaming, music, VR, etc).
By testing audio-only stories on Android, he’s potentially showing a desire to start competing more directly with Spotify*, Apple*, and Amazon* in the podcast and audiobook category. If Netflix chose to do so, it could have a significant advantage given its content library and significant, global subscriber base.
#tech
Intel out.→
James Allworth, Head of Innovation at Clouflare and co-host of the Exponent podcast alongside Ben Thompson, wrote a piece discussing the recent breakup of Apple* and Intel. Apple just released its first Macs with its own line silicon, abandoning Intel’s x86 chipset for good.
James shows how the move off Intel is yet another example of Clay Christensen’s disruptive innovation framework. The irony is that Intel’s long-time CEO Andy Grove deeply understood Christensen’s framework, and that Intel itself benefited from it back in the day:
The causal mechanism behind disruption that Grove so quickly understood was that even if a disruptive innovation started off as inferior, by virtue of it dramatically expanding the market, it would improve at a far greater rate than the incumbent. It was what enabled Intel (and Microsoft) to win the computing market in the first place: even though personal computers were cheaper, selling something that sat in every home and on every desk ends up funding a lot more R&D spend than selling a few very expensive servers that only existed in server rooms.
Similarly, Apple’s initial foray into chips didn’t produce anything that special in terms of silicon. But it didn’t need to — people were happy to just have a computer that they could keep in their pocket. Apple has gone on to sell a lot of iPhones, and all those sales have funded a lot of R&D. The silicon inside them has kept improving, and improving, and improving. And their fab partner, TSMC, has gone along with them for the ride.
The roundtrip story of how Intel both benefited and was disrupted according to Christensen’s theory is another demonstration of impermanence of market leadership in technology.
#science
Gut call.→
Scientists have discovered a strong linkage between the quantity of amyloid plaques in the brains of patients with neurodegenerative diseases like Alzheimer’s and certain bacterial products of microbiota in the gut. The association opens up new lines of therapy for these progressive illnesses, potentially by altering the gut microbiome of patients.
#culture
Mind the partisan gap.→
The aftermath of the U.S. elections has been as contentious as the election itself. While some polling data gave the impression that the country’s partisan divide had begun to close over the last 4 years, new data from the election suggests otherwise. This article from The Economist shows a significant correlation between Democratic vote margin and population density. This is essentially the urban/rural divide in America, which has increasingly become self-reinforcing:
One possible explanation for this trend is the tendency for Democrats and Republicans to live among their own kind. Americans are increasingly sorting themselves into politically like-minded communities. For liberals, this means diverse, densely-populated cities; for conservatives it is places that are mostly white, working-class and sparse.
Enjoyed this newsletter?
Getting Drinking from the Firehose in your inbox via Substack is easy. Click below to subscribe:
Have some thoughts? Leave me a comment:
Or share this post on social media to get the word out:
Disclaimer: * indicates a Lightspeed portfolio company, or other company in which I have economic interest. I also have economic interest in AAPL, ADBE, AMT, AMZN, BABA, BRK, BLK, CCI, CRM, GOOG/GOOGL, FB, HD, LMT, MA, MCD, MSFT, NSRGY, NEE, PYPL, SHOP, SNAP, SPOT, SQ, TMO, TWLO, VEEV, and V.
Header image credit: Techcrunch.











This Doordash article is pure gold. Thanks for providing such an insightful view and in-depth discussion about the topic.